
Quick Start
Your first benchmark
The simplest way to measure code is Benchmark.Run. Call it anywhere - no special project structure, no configuration.
using NBenchmark;

var result = Benchmark.Run(() =>
{
    for (int i = 0; i < 1000; i++) { }
});

result.Print();
Run with dotnet run and you'll see something like:
  ┌─ Benchmark ─────────────────────────────────────
  │
  │  Median: 342.1 ns       Mean: 348.7 ns
  │  Ops/s:  2.87 Mops/s    Median ops/s: 2.92 Mops/s
  │  P95: 361.2 ns  P99: 378.5 ns  P99.9: 380.0 ns
  │  StdDev: 8.3 ns         CV:   2.38%
  │  Error:  ±3.1 ns (0.89% of Mean)
  │  CI:     [345.6 ns … 351.8 ns] (95%)
  │  Alloc/op: 0 B
  │
  └─────────────────────────────────────────────────
That's it. NBenchmark warmed up until the timings plateaued (to let the JIT compile your code), collected enough measured samples to tighten the confidence interval, trimmed outliers using the IQR fence rule, and printed a summary.
Measuring async code
var result = await Benchmark.RunAsync(async () =>
{
    await Task.Delay(1);
});

result.Print();
Measuring a return value
If your benchmark returns a value, use the generic overload. This prevents the compiler from optimising the call away:
var result = Benchmark.Run(() => int.Parse("12345"));
result.Print();
Comparing two implementations
To compare two approaches side-by-side, use BenchmarkSuite:
using NBenchmark;
using NBenchmark.Reporters.Console;

var results = await new BenchmarkSuite("sorting")
    .Add("Array.Sort", () => { var a = data.ToArray(); Array.Sort(a); })
    .Add("LINQ OrderBy", () => { _ = data.OrderBy(x => x).ToArray(); })
    .WithBaseline("Array.Sort")
    .WithReporter(new ConsoleReporter())
    .RunAsync();
The console output will look like: 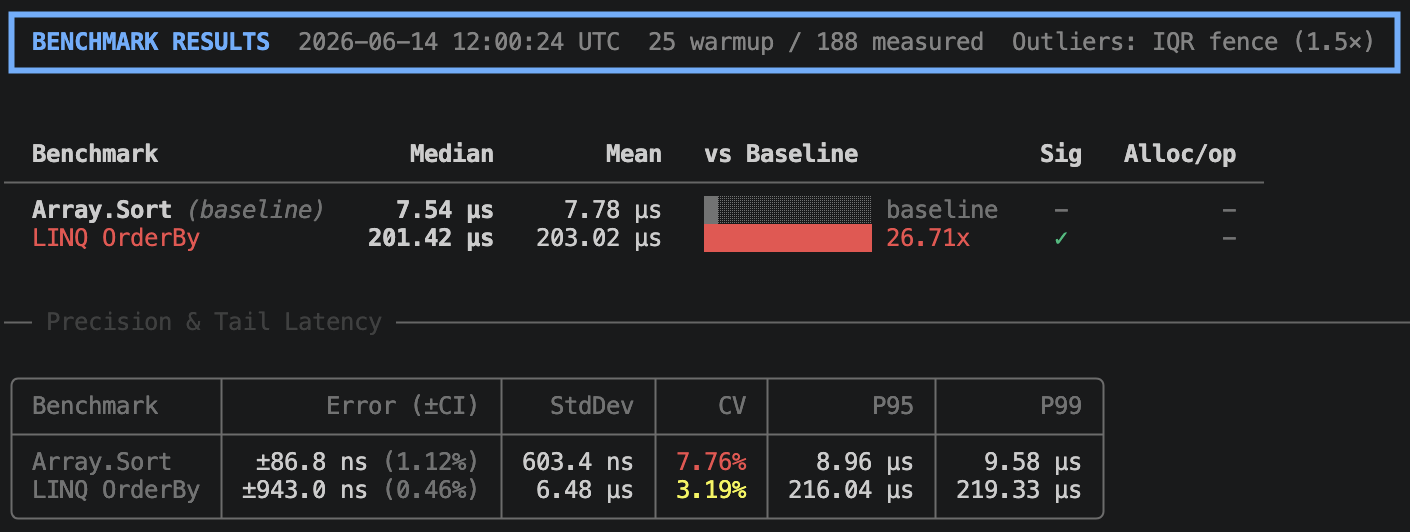
The Ratio column shows speed relative to the baseline. The Sig column shows ✓ when the difference is statistically significant and ✗ when it's not. No symbol means the benchmark is the baseline or significance wasn't tested.
Saving results to a file
Chain file reporter methods on any BenchmarkResult:
var result = Benchmark.Run(() => MyMethod());

await result.ToMarkdownAsync("results.md");
await result.ToCsvAsync("results.csv");
await result.ToJsonAsync("results/");   // directory
What each number means
| Value | What it tells you |
|---|---|
| Median | The middle value - the most reliable single number. Ignores extreme outliers. |
| Mean | The average. Close to the median for stable code; further away when timings vary widely. |
| Error | How precisely the mean is estimated (±95% CI). A small Error means the mean is reliable. |
| StdDev | How spread out the measurements are. High StdDev = unpredictable timing. |
| P95 / P99 / P99.9 | Tail-latency percentiles. P95: 95% of measurements completed within this time. Useful for latency budgets. Configurable via MeasurementOptions.ReportedPercentiles. |
| Ratio | Speed relative to the baseline. 0.75x = 25% faster; 2.0x = twice as slow. |
| Sig | ✓ = difference from baseline is statistically significant; ✗ = not significant (p < 0.05). |
See Key Concepts for a deeper explanation of what these mean and how they are calculated.
Next steps
Now that you have measured one thing, here is a natural progression:
- Key Concepts - understand what warmup, outlier trimming, and the Error column mean in practice
- Suite mode - compare multiple implementations side-by-side (you already saw the basics above; this page covers parameters, isolation, and multi-runtime)
- Harness mode - need dependency injection, attribute-based discovery, or CLI control? Harness mode is the next level
- Reporters and output - save results to JSON, Markdown, or CSV, and add the optional console reporter for colour-coded tables
- Configuration - tune for noisy CI, fast feedback, or publication-grade precision
- Reading Your Results - understand every column, indicator, and warning in the output